Quantcast
Channel: Vinsguru
Viewing all 233 articles
Browse latest View live

Introducing PDFUtil – Compare two PDF files textually or visually

$
0
0

In my project, I need to compare tons of PDF files. I could not find any good FREE library which is working out of the box to compare the PDF files. I did not want just Text compare & I was looking for something which can compare PDFs pixel by pixel to find all the differences.  Libraries which can do are NOT FREE.

So, I have come up with a simple JAVA library (using apache-pdf-box – Licensed under the Apache License, Version 2.0) which can compare given PDF documents in Text/Image mode & highlight the differences, extract images from the PDF documents, save the PDF pages as images etc.


Download:


	taguru-pdf-utility-v1.0.zip	(1020 downloads)


Example:

  • To get page count
import com.taguru.utility.PDFUtil;

PDFUtil pdfUtil = new PDFUtil();
pdfUtil.getPageCount("c:/sample.pdf"); //returns the page count

  • To get page content as plain text

//returns the pdf content - all pages
pdfUtil.getText("c:/sample.pdf"); 

// returns the pdf content from page number 2
pdfUtil.getText("c:/sample.pdf",2); 

// returns the pdf content from page number 5 to 8
pdfUtil.getText("c:/sample.pdf", 5, 8);

  • To extract attached images from PDF

//set the path where we need to store the images
 pdfUtil.setImageDestinationPath("c:/imgpath");
 pdfUtil.extractImages("c:/sample.pdf");

// extracts & saves the pdf content from page number 3
pdfUtil.extractImages("c:/sample.pdf", 3);

// extracts & saves the pdf content from page 2
pdfUtil.extractImages("c:/sample.pdf", 2, 2);


  • To store PDF pages as images

//set the path where we need to store the images
 pdfUtil.setImageDestinationPath("c:/imgpath");
 pdfUtil.savePdfAsImage("c:/sample.pdf");

  • To compare PDF files in text mode (faster – But it does not compare the format, images etc in the PDF)

String file1="c:/files/doc1.pdf";
String file1="c:/files/doc2.pdf";

// compares the pdf documents & returns a boolean
// true if both files have same content. false otherwise.
pdfUtil.comparePdfFilesTextMode(file1, file2);

// compare the 3rd page alone
pdfUtil.comparePdfFilesTextMode(file1, file2, 3, 3);

// compare the pages from 1 to 5
pdfUtil.comparePdfFilesTextMode(file1, file2, 1, 5);

  • To compare PDF files in Binary mode (slower – compares PDF documents pixel by pixel – highlights pdf difference & store the result as image)

String file1="c:/files/doc1.pdf";
String file1="c:/files/doc2.pdf";

// compares the pdf documents & returns a boolean
// true if both files have same content. false otherwise.
pdfUtil.comparePdfFilesBinaryMode(file1, file2);

// compare the 3rd page alone
pdfUtil.comparePdfFilesBinaryMode(file1, file2, 3, 3);

// compare the pages from 1 to 5
pdfUtil.comparePdfFilesBinaryMode(file1, file2, 1, 5);

//if you need to store the result
pdfUtil.highlightPdfDifference(true);
pdfUtil.setImageDestinationPath("c:/imgpath");
pdfUtil.comparePdfFilesBinaryMode(file1, file2);


For example, I have 2 PDF documents which have exact same content except the below differences in the charts.


pdfu001                                      pdfu002


My PDFUtility gives the result as given below (highlights the difference in Magenta color by default. Color can be changed).

pdfu003


Share This:


JMeter – Modularizing Test Scripts

$
0
0

In this article, Lets see how we can modularize the JMeter load test scripts for easy maintenance / reusability.

To achieve that we need to know about the following JMeter elements.

  1. Test Fragment
  2. Module Controller
  3. Parameterized Controller
  4. Include Controller

Test Fragment:

Test Fragment element is a special controller which can be added directly under JMeter test plan like Thread Group. But It does nothing except holding other elements inside!! It gets executed only when it is referenced by a Module/Include controller from other Thread Groups. It acts like a library of reusable of scripts.

Module Controller:

Module Controller in JMeter is useful in referencing any of the logic controller in the JMeter Test Plan.

For Example, I have 5 thread groups as given below in my test.

  1. New User Registration
  2. User Login & Order Creation
  3. User Login & Product View
  4. Existing Order Edit/Cancel
  5. User Search

Some functionalities could be common for these thread groups. For example, User has to login to crate orders / to view the existing products.

mod001

In the above example, you can see, Both thread groups have to have the login functionality. Whenever the login functionality changes, I need to ensure that I update the script in both thread groups.

So, instead of having duplicate simple controllers for login in both thread groups, I can add a Test Fragment & move the ‘User Login’ Simple Controller under the Test Fragment. So that it can be referenced by a Module Controller. [It does not have to be a Simple Controller always. It can be any controller].

mod002

Now, If the script for login changes, I have to just update the ‘User Login’ under the Test Fragment. Both thread groups will work just fine.

Parameterized Controller:

One ‘User Login’ is being accessed by more than 1 Thread Group in the above example. Sometimes, these Thread Groups might want to use these Simple/Transaction controllers under the Test Fragment like a function so that they can pass different data & they expect the controllers to perform the actions based on the data passed to it.

For example, My requirement is to use VISA credit card while ordering a new product & to use MasterCard while editing/upgrading the existing order. [Sorry if it is a stupid example. :)]
I can use a Parameterized Controller for this purpose.

mod003

I add the Parameterized Controller first. Then I add the Module Controller under the Parameterized Controller. Now the Module Controller calls the ‘Checkout’ & passes the test data to be used in the ‘Checkout’.

mod004

mod005

Checkout controller will use test data passed to it while performing the requests.

mod006

Include Controller:

As a Module controller is used to call a logic controller in the Test Plan, Include Controller is used to reference an existing .jmx file itself.

For Example,  The application is very complex & 2 engineers are involved in script creation.
Developer A is creating a test script for Login & Searching for the Products functionality of the application.
Developer B is creating a test script for Checkout.

Both engineers come up with a different .jmx files for the different modules of the application.

Now we create the final JMeter test plan which will reference these external ‘.jmx’ files as given below.

mod007

I can have different jmx files for Login, Order Product, Product Search, User Search, View Product, Edit Order, Cancel Order

Now I can create any business flow I want by referencing the external jmx files. [Add the User Defined Variables, Cookie Manager etc in the final JMeter Test. Not in the included files. ]

Login -> Order Product -> View Product
Login -> Order Product -> Edit Order
Login -> Product Search -> Order Product
Login -> Order Product -> Product Search -> Cancel Order


Share This:

Hybrid Test Automation Framework

$
0
0

There are 4 most popularly used automation frameworks.

  1. Modular
  2. Data driven
  3. Keyword Driven
  4. Hybrid

First 3 frameworks have their own pros and cons. Hybrid framework is the combination of all 3 by using all the pros and minimizing the cons.

In this post, I would like to show how I have implemented my hybrid automation framework using QTP for one of the projects.

Folder Structure:

My folder structure is as given below.

hy001

  • data – contains all the test data/expected files to be compared/files to be uploaded for testing purposes.
  • lib – contains reusable application independent jar/dll
  • objectrepository – properties to identify the elements in the application. [I have used a lot of descriptive programming. But I also like to keep the test identification properties away from the test script.]
  • functions – VBScript functions/Business actions.
  • properties – test environment/database details / any test execution specific details.
  • tests – Spreadsheet containing all the automated test cases details & keywords to be called.
  • suites – test suites which contains test case numbers to be executed.
  • output – it has sub folders for storing the result files, log files, any files to be downloaded while the test is running.
  • runner.exe – an executable – driver script which launches QTP & executes the test

Lib Folder:

If I need to create some libraries which is not going to be application dependent, then i write that in .net instead of VBScript. Because We can write better code in .Net, it runs faster, has many reusable libraries, OOPs support, better error handling than VBScript.

Ex: I have below utilities created.

  • ExcelUtil – To read spreasheet, compare etc
  • JSONUtil – to read/write files
  • ReportUtil – To create custom execution report once the test execution is complete.
  • DBUtil – To connect to the DB & execute queries
  • SMTPUtil – To send emails
  • IMAPUtil – To read emails & extract the content
  • ImageUtil – To create/compare images
  • ChartUtil – To create charts for the given data
  • PDFUtil – To read/write/compare PDF files

Properties Folder:

This folder contains a default properties file & an environment specific property file.

hy008


Each property is set as Environment Variable for QTP.

Functions Folder:

These are all application specific business actions written in VBScript.

Ex: I have below action keywords to execute some business functionalities specific to my application under test.

  • CREATE_ORDER – to create an order for an user
  • VIEW_ORDER – to view an existing order
  • EDIT_ORDER – to edit an existing order
  • DELETE_ORDER – to delete an existing order
  • CREATE_USER – to create user
  • SEARCH_USER – to search for an user

Above high level business action/keywords are QTP/Selenium automated test scripts. Whenever these keywords are called, the corresponding test script is executed.

For Ex: It could be something like this.

Function CREATE_ORDER

' select product for the given product code
' click on order button
' enter payment details
' checkout
' check for the conformation

End Function

Tests Folder:

It contains a spreadsheet in which we add the automated test cases.

TestCase sheet:

hy002

It contains list of all the testcases for the application. It contains the test case ID, test description & corresponding business actions to be executed. By calling these actions in the given sequence, we get the business flow verified.

For Ex: For TC001, We need to create an user & order a product. So we call 2 actions – CREATE_USER & CREATE_ORDER. To order different products, the same function is called as the business flow is same and only the product is different (Data-driven). So we create another test case, TC002 – We call those 2 actions again.
To get the testdata for the action, driver reads action-data mapping sheet.
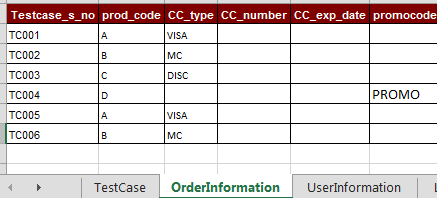
For Ex: Below sheet shows that for CREATE_ORDER business action , it can find the test data in the ‘OrderInformation’ sheet.

hy003
Driver goes to ‘OrderInformation’ sheet and gets the test data from this sheet by using the testcase ID.  In the below image, TC001 & TC002 have different test data. Eventhough TC001 and TC002 have the actions, they use different test data and tests different products.

hy004


Suite Folder:

Test case spreadsheet contains all the possible test cases for the application. Suite file contains group of test cases to be executed for a functionality.

For ex: I might have 1000 automated test cases in total from different modules of the application. But i might be interested in running only 100 testcases specific to ‘order’ module as there could be a recent change in the particular module of the application. So i create a suite file which contains only order related cases to execute.

hy005

Sample Suite File:

hy006                               hy007


How It Works:

hy010

  • Runner.exe: It expects 3 parameters.
    • Environment in which all the tests need to be executed (like PRODUCTION/PPE/QA…)
    • Browser (IE/FF/Chrome)
    • Suite (name of the suite file which contains the test numbers to be executed.

It invokes the QTP using its Automation Object Model & loads the environment variables, starts running the QTP – It also keeps monitoring the execution, logs the results in the console.

Check here to log QTP result in the console.

  • Driver:
    • It reads test case IDs from the suite files.
    • Using these ID, It gets the Business Action Keywords to be executed from the ‘Tests’ spreadsheet.
    • For each Business Action Keyword, It reads the test data
    • Once the test data is read, It calls the Keyword.


Share This:

Automated Smoke Test – Best Practises

$
0
0

In this post, I would like to show how I have implemented automated smoke test in my project. It is based on the Hybrid framework I had implemented. I would request you to read the post on Hybrid Framework first if you have not.

Problem Statement:

asm003We follow agile methodology & we have a release once in every 4 weeks. We have many environments like Production(of course, yes), Pre-Production, UAT, QA1-2, Dev1-2 etc. New code is pushed to the QA environments twice a day!! Few days prior to the release, We get builds in multiple environments like QA, UAT & PPE on the same day for different purposes. We needed to spend sometime to ensure that the new code does not break any basic functionalities of the application before doing actual testing. We also need to ensure that connectivity to the external systems works fine. It is called Smoke Test.

  1. A set of test cases are executed repeatedly as and when we get new code on an environment.
  2. We need to execute same set of test cases in multiple environments whenever the code is pushed to the environment. (Even though it is same code, there are a lot of configurations which affect the application behaviors).
  3. Doing smoke test manually once takes 15 mins. This effort can be saved as we do that many times a day.
  4. Dependency on the QA team. Apparently Developer/someone else does not want to do smoke test. If no tester is available at the time of code push, developers do not get the smoke test results immediately.
  5. Very boring activity. :(

Solution:

The only solution is to automate the smoke testing process. The existing Hybrid framework can easily work here by creating a separate suite file for smoketest.

  1. Identify Test cases: We have more than 3000 automated test cases included in the automated regression suite which covers almost all the features of the application. As part of smoke test, We need to pick the test cases to cover that basic functionalities of the application.
  2. Create a suite file: Once the test cases are identified, create a suite file (Say, smoketest.suite) with the test case numbers identified.
  3. Execute:  Runner.exe in the framework,  expects 3 arguments.
    • Environment in which we need do the smoke test
    • Browser: IE is default
    • Suite: smoketest.suite

Now runner.exe invokes QTP & executes the identified test cases & creates the result file.

Jenkins Integration:

By using existing framework & creating a suite file, we now have the smoke test created which will work for the given environment. But still we have the dependency on the QA team members to invoke it. How can be it solved?   Jenkins

[Not sure how to integrate? Please check this guide]

We already keep all the automated test cases in Stash repository. Jenkins can pull everything & trigger the runner.exe by passing the required arguments in the remote slave machine.

I created a separate job for Smoke Test in Jenkins as given below.

asm001


As Jenkins is a web based application, anyone can access it by using its URL. Whenever there is a code push, someone in the team (does not have to be a QA guy anymore) – they click on the build button by selecting the environment to trigger the smoke test on the environment.

Runner.exe also creates a nice (is it not nice?) HTML result file as given below with the test cases details executed. Jenkins sends the smoke test result to the entire team members. In case of issues, developers can look into that immediately.

asm002


Summary:

Thus an automated smoke test process was implemented by using the existing Hybrid framework. This practice i had implemented had a huge impact in the team & saved a lot of time  and reduced the dependency.


Share This:

JMeter – Until Controller – A Custom Controller

$
0
0

I have been using JMeter for the past 2 years & I always found that difficult when there is no easy way to exit from the loop in case of error. I was looking for something like break statement in Java inside a while / for loop.

JMeter has If Controller which will let you execute the Samplers based on the condition. So, We can actually exit from the loop by designing the Test Plan with standard controllers available with JMeter.

For Example,

while001

As part of my project requirement, I had to execute above transactions in the given order. I do the Login first. Then I keep doing all the transactions inside the While Controller again and again. For this requirement, above setup should work well!

But the problem arises, when there is some failure occurs in any of the transactions.

Say, I search for a product. If the product is not available, there is no point in executing other transactions like – Ordering product, entering payment details, viewing product etc!! They are going to fail for sure!!

So, To make the test as I want with standard controllers, I have to design as given below.

uc-pu-001

Yes, above test plan should work well. But, in this case, I have only few transactions. What if I have 100 transactions? Should I have to add 99 If controllers after the first one!!? Does it not make my test plan very difficult to maintain? Yes, It actually does :(.

Until Controller:

So, I wanted to have my own controller which keeps executing all the samplers inside & but checks for the status of the previous sampler/transaction before proceeding. If the previous request passes, send the next request; If any of the sampler/transaction fails, exit from the loop/controller. [Thank God – JMeter is open source!!]

Why is it called Until Controller? – It keeps executing all the samplers until some failure occurs.

How It Works:

Lets see this example. I have a test plan as given below. (1 thread – runs forever)

uc001


When i run the test, I see the output as given below just like I had expected. (Just execute all the samplers inside the until controller again and again).


uc001a


When some samplers fail, just stop the controller’s execution & exit from the loop. Go to the next sampler after the ‘Until Controller’.

uc001b


This was exactly as I wanted. So, I can remove all the If Controllers, Create my test plan as given below.

uc-pu-001   becomes like this using ‘Until Controller’ uc010


Performance:

The behavior is almost same like While Controller, I just wanted to compare the performance of Until Controller (logic of the controller should not affect the test’s performance) with while controller.

I had some samplers inside both controllers & ran it for sometime with no timers. They take sametime in both Pass & Fail cases..

uc-perf-pass

uc-perf-fail

Download:

If you would like to try, Please download it from here & place the jar under JMETER_HOME/lib/ext


	UntilController.zip	(85 downloads)


Note: It will work only with JMeter version 2.13 or above.

Share This:

JMeter – Real Time Results – InfluxDB & Grafana

$
0
0

In this post, I would like to show how I have implemented – getting real time results from JMeter using InfluxDB & Grafana.

Problem Statement:

JMeter has enabled the summariser output from its version 2.11 in Non-GUI mode. You can see below output when you run your JMeter test.

06_summariser

Above summary gives decent amount of information you would need while the test is running. It shows the minimum, maximum, average responses times, throughput, error count, no of active users for every 30 seconds (summary interval can be changed in jmeter.properties).

But when the test runs for hours & when you have huge amount of summariser output in the console for every 30 seconds, It might be a bit difficult to understand the results. For ex, If i would like to know the active user count at which the rate drops, I need to go through the summariser output line by line very carefully!  I can not share the results with the development team/appliucation architect as the results are not very user friendly format. To create a nice graph, I need to wait for the jmeter test to finish; So that i can access the jtl file  & create graphs.

Backend Listener:

JMeter v2.13 has introduced a new listener to send the results to a time-series database (influxdb/graphite) while the test is running. By configuring Grafana (an open source metrics dashboard) to connect to the influxdb/graphite, We can create nice graphs while the jmeter is running the test!!

integration

Time-Series Database: time series is the sequence of data taken over time. Time-series database is a software application which handles the time-series data. Imagine it like a sql-table in which time is the primary key!

How to implement:

  1. Ensure that you have Java version 6 or above.
  2. Download JMeter v2.13 or above.
  3. Download InfluxDB & Setup
    1. Download influxdb.
    2. Setup. Check this link. [Note: at this time of writing this post, v0.9 is latest influxDB version.  If this link does not work, Please check the influxdb site for more information.]
    3. Start influxdb server by issuing command influxd
    4. Launch InfluxDB admin interface by typing this URL: http://localhost:8083  or http://<ip of influxdb>:8083
    5. Create a database with the name ‘jmeter’: CREATE DATABASE jmeterinflux-db-creation
    6. Update config file of influxdb (in this location: /opt/influxdb/shared/config.toml or /usr/local/etc/influxdb.conf) to get the results from JMeter.
      influx-config
  4. JMeter-InfluxDB Integration:
    1. Launch JMeter. Create a simple test.
    2. Add Backend Listener.                                    backend-listener-setup
    3. Update the influxdb server ip, port details as given below.
    4. Run the test.                                                                                                                                                                                   jmeter-test
    5. Now you can see the data coming to the influxDB.  JMeter has created below measurements in the ‘jmeter’ database of InfluxDB. (measurement is like a SQL table).influx-measurements
    6. If I query the “jmeter.all.a.count” which has the no of requests processed for every second by the server, I get below output.query-table
  5. Grafana-InfluxDB Integration:
    1. Download Grafana
    2. Start the grafana server. (In my windows, GRAFANA_HOME/bin/grafana-server.exe)
    3. Launch browser & type : http://localhost:3000 to access the grafana home page.
    4. Update grafana data source to point to the influxDB instance.                                              grafana-data-source
    5. Click on the Test connection to ensure that Grafana can connect to the InfluxDB.
    6. Once Grafana can query the influxDB, I can create a simple graph to get the requests processed by the server / second. (By querying jmeter.all.a.count table which has the value for every second)grafana-graph


Summary:

With new backend listener, We do not need to wait for the jmeter test to finish to get the results! I have implemented below dashboard in Grafana & shared the URL with the team to see the results while the test is running!!

my-grafana-dashboard

Share This:

Continuous Regression Testing – Best Practises

$
0
0

In this post, I would like to show how I have implemented automated continuous regression testing process in my project. It is based on the Hybrid framework, I had implemented. I would request you to read the post on Hybrid Framework first if you have not.

Problem Statement:

  • We follow agile methodology & we have a release once in every 4 weeks. For every release, we push tons of new features into the existing application.As part of the addition of new features/requirements, we also introduce new defects in the existing application.
  • When we have 2 weeks for development, 1 week for QA & 1 week for deployment activities for a release, It is very hard to complete all the testing on all the new requirements & the regression testing to ensure that existing requirements of the application are still working as expected.
  • New code is pushed to the QA environment daily! So, even if some test cases pass today, they might fail the next day as code is frequently modified!!!
  • No one wants defect to be found in the last min as it is very costly to fix & it will also affect the release plan and subsequent releases. Detect defects as soon as they are introduced!!

Continuous Integration :

While developing a software, developers might check-in their code very often a day (at least once). This integration should be verified (using build tools, unit & integration tests) to ensure that software is not broken/developers do not introduce any defect. This process is called Continuous Integration & It is development practice to detect these code integration related issues as early as possible in the software development life cycle.

Above process is helpful in finding all the unit testing / integration testing related issues earlier. It might not find all the functional issues. Why do we, automation engineers, not follow the similar process to detect application functional defects earlier?

Automated Continuous Regression:

I have 3000 test cases in our automation regression suite which, an automated testing tool ,will take 90 hours to execute all the test cases as most of the test cases are very complex!!! All the 3000 test cases are split into multiple suite files based on the business functionality as given below in the picture 1.

hy007

We create a separate jenkins job for each suite file.(We use QTP for a project & Selenium-WebDriver for other. We use hybrid framework for both. So this process is not specific to QTP projects. It can be used for any automation testing project).

arch

Each jenkins job is scheduled to run daily @ 7PM by then we would have received the latest build from the development for the day with all the defect fixes. We have 10 slave machines connected to the jenkins master. So the entire automated regression suites are run daily by the jenkins master on different slave machines. By next day morning, All the 3000 test cases would have been executed & results would be ready ready for analysis.

Advantages:

  • Huge effort saving by automating 3000 test cases.
  • 0 hr spent in regression testing + few hours for result analysis.
  • Reduced time to market
  • Improved the code Qualtity.
  • Any new defects introduced today will be caught by next day morning.
  • It has greatly reduced the unnecessary dependency on the QA team for the Regression status.
  • Testing team focuses more on testing the new features planned for the release.

Dashboard:

We also have created below dashboard to display all the test case execution results for the past few weeks. This is helpful in triaging failed test cases. To know the build version in which a functionality was broken.

qdashbaord

Share This:

JIRA – Automated status report

$
0
0

In this post, I would like to show how I have implemented automated status reporting from JIRA.

In my organization, I help with automation testing for multiple projects. One of the projects, they use JIRA for defect tracking. I was approached to implement something similar to this (which i had already done for HP ALM) for a different project.

The goal was to send 2 different emails daily- 1 is for defect status and the other is for test execution status.

JIRA API:
JIRA has exposed most of its functionalities via REST API. So you can create/edit/get issues programmatically.
Please check this link to get an idea of JIRA REST API.

Design/Framework:

The design would be similar to the one I had done for HP ALM. Because all the libraries were reused. I created one library for JIRA which will replace the one for ALM. Everything else would be simply reused.

jira-design

Properties File:

This is a sample properties file which is read by the executable to create the status emails.

jira-properties

Sample EMail:

The automated email sent is similar to thisStatusEMail.

Summary:

By creating a simple utility, we saved a lot of time in status reporting which gives more accurate defect status & test execution status. It also has been designed to be used for any project by updating a config file.


Share This:


JMeter – Find Broken Links

$
0
0

In this post, Lets see how we can use JMeter to find all the broken links for a given URL.

Wait a minute! Are we going to use JMeter to find the broken links on a web page? Is JMeter not for performance testing?

Yes, JMeter is a performance testing tool. But It can also be used for your functional testing! I do a lot of functional testing with JMeter. Actually JMeter is like any other web browser (Chrome/FF/IE etc). But there are few limitations.

  1. It does not execute JavaScript like your web browser. (It makes sense for JMeter not to execute the js files as it was designed for performance testing the server. Not your local machine which will execute the js files)
  2. It does not make AJAX calls in parallel.

So, If we know the limitations of JMeter, we know where to use it. Apparently it can not be used to verify if the text boxes are aligned properly in the UI when we access the web page. But we can use it to validate the HTML source. Why not simply use UFT/WebDriver? Because JMeter is very fast & easy to implement with the existing controllers!


Lets see how to create a simple test plan in JMeter to find the broken links on a given page. (Please note that there are many tools/browser plugins available to find broken links. But our aim here is to see how JMeter can be used for this purpose/just to give you an idea. I am not arguing here that JMeter is the best option to do such things).

  1. Lets launch JMeter
  2. Add a Thread Group
  3. Add a HTTP Request under Thread Group
  4. Update the URL of the web page on which we need to find the broken links
  5. Add a ‘Regular Expression Extractor‘ under the HTTP Request
    • This is to extract all the links.
    • Expression would be (href|src)=”(.*?)” (get all the href/src attributes values)
    • Template would be $2$ (we need the second sub match which has the URL/Path to be checked)
    • Match No would be -1 (to get all the matches)
  6. Add a ForEach Controller (To iterate all the links)
  7. Under ForEach controller, Add a HTTP request (this is to send the HTTP request & see if the given link is broken or not)
    • Optional: We can add a HTTP request under a ‘If Controller’ to handle href attribute values like ‘#’ ot to skip certain patterns. Or we can update the Regular expression pattern to get only the matching URLs in the step 5.
    • Optional: We can also add a ‘Beanshell PreProcessor’ under this HTTP request to do any pre-processing.

Simple Test Plan to find Broken Links:

jm-brokenlink-test-plan

Now Lets assume we have a huge list of URLs/Pages for which we need to find the broken links.

Lets modify the above test plan as given below. (like creating a reusable function using Test fragment/Module Controller)

jm-brokenlink-test-plan-mod

In the above example, We have the list of URLs in CSV file. Main aim of the thread group is to read the URLs from CSV file & give it to the Module controller.

‘Broken Link Finder’ module is responsible for finding all the broken links.

By designing this way, we can call the ‘Broken Link Finder’ as and when we want in your test plan.

Summary:

JMeter can save a lot of our time if we can implement it correctly for our functional test requirements like this. We can also use JMeter to do certain data setup. For ex: In my project, I use JMeter to create thousands of test users, to quickly verify if the servers are up and running etc.


Share This:

JMeter – Response Data Extractors – Comparison

$
0
0

If you are using JMeter, You would have also used any of the below Post Processors to extract information from the Sampler response and use it for the subsequent request or response validation.

  1. CSS/JQuery Extractor
  2. JSON Path Extractor
  3. Regular Expression Extractor
  4. XPath Extractor

But do they all perform same? How do they affect the JMeter test performance? Lets see in this article.

Test Plan:

To compare these post processors, I need to create a very simple test plan with no external dependency for accurate results.

The Test plan is as given below.

  1. Thread Group
  2. Dummy Sampler

simple-test-plan

I use an XML as the Response Data (Taken from http://www.w3schools.com/xml/cd_catalog.xml)

simple-test-plan1

Latency & Response Time simulation are all turned off. No timers are included.

The Test Setup is as given below.

test-setup

We create 5 identical tests

tests

  1. css.jmx -> Test plan with CSS/JQuery Extractor.
  2. json.jmx -> Test plan with JSON Path Extractor – Response data has the CD Catalog xml in JSON format.
  3. nopost.jmx -> Test plan with no Post Processors.
  4. regex.jmx -> Test plan with Regular Expression Extractor.
  5. xpath.jmx -> Test plan with XPath Extractor.


Everything is ready now!! Lets run the tests in Non-GUI mode one-by-one. (I ensured that all the applications were closed before running).

Test Results:

I ran the same test 5 times and took the average. The results are as given below.

Test Plan Name Count Rate (/s)
CSS/JQuery Extractor 569288 9482.4
JSON Path Extractor 1353122 22533.6
Regular Expression Extractor 2051809 34176.9
XPath Extractor 288726 4809
No Extractor Included 9037481 150471.7


Conclusion:

When we look at the Count (no of samples sent in 60 seconds) and Rate (throughput) from the above table for the tests we did, It is obvious that these extractors affect the performance of my test. When i do not have any post processor, I was able to make more than 9 Million requests within 60 seconds. But when we add a post processor to process the response data, as these post processors utilize CPU and Memory, they affect the test performance.

If we rank all these extractors based on their performance,

  1. Regular Expression Extractor
  2. JSON Path Extractor
  3. CSS/JQuery Extractor
  4. XPath Extractor

Regular Expression Extractor seems to perform much much faster compared to other post processors we compared with. XPath Extractor performs very poorly. It kind of makes sense as it needs to build a XML DOM from the response String and it needs to traverse it to find all the TITLE tags.

It does not mean you should not use XPath Extractor at all. We should be aware of the performance of these extractors and try to minimize the use of CPU consuming post processors. If possible, always use Regular Expression Extractor as it takes less memory and CPU.

Share This:

JMeter – Continuous Performance Testing – JMeter + ANT + Jenkins Integration – Part 1

$
0
0

AIM:

To implement Continuous Performance Testing process in the SDLC to detect any performance related issues as early as possible & also to reduce any dependency on the performance engineers for running the scripts and analyzing the results.

Lets see how we can implement the above process in this post by using below open source tools.

Create Performance Test Script:

  1. Create some basic performance test script using JMeter.
  2. We will be parametrizing our test using User Defined Variables as given below. So in the debug mode, it takes the default values (like 1 user with 1 second ramp-up for 5 seconds test duration).
  3. Ensure that the scripts runs fine.

jmint-01                         jmint-02


Running JMeter test using ANT:

ANT: It is a build tool – here we will be using ANT to execute a set of tasks in the given order. For ex:

  • Cleaning the project by removing the temp files for a fresh test.
  • Running the test by passing the test properties from Jenkins to JMeter.
  • Creating reports
  • Creating charts

Install ANT:

  1. Download Ant from here.
  2. Uncompress the downloaded file into a directory.
  3. Set environmental variables
    • JAVA_HOME to your Java environment
    • ANT_HOME to the directory you uncompressed Ant
    • Add ${ANT_HOME}/bin (Unix) or %ANT_HOME%/bin (Windows) to your PATH.
    • If you do not have a JMETER_HOME variable, please set that too. It should point to the JMeter folder where you see ‘bin’
  4. In the cmd prompt/terminal, type ant and enter as given below. You should see below message (The system should know that there is an ‘ant’ command)

jmint-03

Create ANT-JMeter Project:

Now we are going to create an ANT project as given below.

jmint-04test folder is going to contain your .jmx file

lib folder will have all the libs required for ant-jmeter task + any other libs you want to include for your jmeter test.

function folder will have all the beanshell scripts for your test.

build.properties A property file which is going to pass the values for JMeter UDV.

jmint-05

build.xml file:

This is an important part. Ant needs a build.xml file (it does not have to be ‘build.xml’ – but thats a default name ant will expect) where you have all the tasks defined.
Lets create a build.xml file as given below. [You can download the complete project at the end of this post]

jmint-06

We have 3 targets here.

  • clean -> cleaning the temp folders created as part of our test
  • show-test-properties -> Displays the values we pass to the test
  • run -> Runs the jmeter test

Now in the command prompt/terminal, go to the project folder and type ‘ant show-test-properties‘. You should see below output.

jmint-07

ANT: Run JMeter Test:

Lets run the test by issuing command: ant run

jmint-08

Now we can see we have the log and result files created.

jmint-09

jmint-10


ANT: Create Report:

We have the result files created. Let’s add one more target in our build file to get the aggregate report from the result.jtl into HTML file.
[For that we need 2 jars & XSLT file to generate HTML from XML – I have included everything in the project folder]

jmint-17


Generate report by issuing command: ant generate-report

jmint-13

jmint-15

We can see a nice HTML aggregate report as given below. (You can also modify the XSLT file to include throughput details).

ANT: Create Charts:

Let’s add one more target in the build.xml file for creating charts from the result.jtl file.

jmint-18


Generate charts by issuing command: ant generate-charts

Once the job is complete, We can see all the charts we wanted are generated and placed under the result folder.

jmint-c-2

jmint-c-1


ANT: Run all tasks:

Run all ant tasks by issuing a command: ant all

jmint-16


Download: CPT Project:

  • I am allocating 5GB memory for JMeter test. You need to modify the value in the build.xml as per your machine configuration. Otherwise the test might fail.
  • This project contains all the jars, XSLT, build.xml files to run and practice out of the box assuming you have JAVA, JMeter and ANT installed.

	CPT Project	(9 downloads)


Summary:

Now we will be able to run our JMeter test by passing the test properties from a property file through ANT. We also have automated creating HTML file and creating charts from the result file.

We will see how to invoke this test from Jenkins in the next post.


Thanks to [Ref: http://www.programmerplanet.org/projects/jmeter-ant-task/]


Share This:

JMeter – Continuous Performance Testing – JMeter + ANT + Jenkins Integration – Part 2

$
0
0

AIM:

To implement Continuous Performance Testing process in the SDLC to detect any performance related issues as early as possible & also to reduce any dependency on the performance engineers for running the scripts and analyzing the results.

Note: If you have not read this post – I would advise you to read the Part 1 of this post which talks about JMeter + Ant integration.

Jenkins Install:

Please check this link for the detailed steps on installing Jenkins on various OS.

Create Jenkins Job:

  • Create a simple free style project.

jmjen-01

  • Build step should be ‘Invoke Ant

[We will use Default Ant assuming the slave machine has Ant installed already. if not, Let jenkins install ANT automatically.]

jmjen-03

  • We will invoke the target ‘all‘ as the target ‘all’ executes below tasks we wanted to execute.
    • clean
    • show-test-properties
    • run
    • generate-report
    • generate-charts
  • our test uses below properties. We will be passing the values for those properties from Jenkins to JMeter through Ant as given above.
    • threadgroup.count
    • threadgroup.rampup
    • threadgroup.duration
  • Our project folder is present under C:/workspace/CPT. So set the custom workspace accordingly.

jmjen-02

  • Our tests creates the results under result folder. We need to archive the files we need as given below. To archive all files under result, use result\*.*

Note: Jenkins will look for the files under the workspace. So set the path relative to the workspace.

jmjen-04


Invoke JMeter Test from Jenkins:

  • If all the above steps have been done correctly, Clicking on ‘Build’ will do to run the jmeter test. We can see a nice output as shown below. It runs the test for 3 users with 3 seconds as rampup period for 100 seconds.

jmjen-05

  • Once the test run is complete, Jenkins archives all the files under result folder. It includes the HTML file + PNG charts we have created. It archive the results for each and every run & they get stored in the server where jenkins is running.

jmjen-06

  • Instead of using hardcoded test properties, we can let our team member enter these values in Jenkins UI. To make it work, we need to make this job parameterized & Let’s create 3 parameters as our test expects 3 parameters to run. We can also have default values for those parameters.

jmjen-15

  • Modify the Build -> Properties section to use the Jenkins parameters we have created.  This step is required because Ant expects values for these variables ‘threadgroup.count’..etc.  [You can also avoid this step by creating the jenkins parameters like this : Instead of USER_COUNT,  We can have create threadgroup.count as Jenkins Parameter name. ]. Since Jenkins parameters and Ant parameters are different , we should map as shown below.

jmjen-16

  • That’s it – Now, We should be able to pass the parameter’s values required for the JMeter test directly from Jenkins UI. Enter some values and click on Build. Console will show the new values passed to the test and JMeter will run the test accordingly. Below output shows the JMeter invokes 5 threads.

jmjen-17


jmjen-18

Jenkins-Performance Plugin:

Jenkins has a plugin for JMeter to parse the result files, create an aggregate report, create charts and to compare the current result with previous results etc.

You can find more details on the plugin here. 

[Note that: This plugin parses the result file only if the results are stored in the XML format. If you prefer to use CSV format, It will not work]

Once the plugin is installed, for the Jenkins Job, we can find ‘Publish Performance test result report‘ under Post build actions.  In the Report files section, give the relative path (to the workspace) of the output jtl file. 

jmjen-08

  • When we run our tests couple of times, we can see Jenkins starts comparing the result of the performance test with previous test and shows the nice summary output. [You see a lot of 0 as response times in the below summary because i use a debug sampler for this demo which does not take time to execute. Response time chart shows a starighline because they are always 0 in my tests.]

jmjen-09

  • To get more details on each sampler, click on the sampler. Jenkins will provide the response times charts for each and every sampler as shown below. It also shows the data in the tabular format along with HTTP response codes which is nice!!.

jmjen-10

Emailing the Results:

Jenkins has a nice plugin for Emailing the results. Please check this link for more details.

Once the plugin is installed, You can find a post build action ‘Editable Email Notification

  • Under triggers of the Editable Email Notification, We will be setting the trigger as ‘Always’ [Always -> whether test fails or not. You can also change the trigger to send the mail only if the test passes etc]
  • Once JMeter runs the test, the post build actions are getting executed consecutively in the order they are present in Jenkins Job/Project config.  So, When this ‘post build action’ gets executed, the result files would have been already created under the result folder.  We might want to include the HTML file in the Email body and attach the images. [If you do not want HTML in the Email body or you use TXT format, attach the HTML file as well as attachments along with images]
  • Below screenshot will give an idea of the basic config to send the mail. [I assume you have already setup email server configuration or your Jenkins administrator will do that]

jmjen-12

  • Lets run our test one more time to see if Jenkins can send out the results for us after running the test.
  • And..Yes….I got the email as shown here!!!

jmjen-13

  • All the charts files are also attached in the email received.

jmjen-14


Summary:

We did a nice job by integrating JMeter with Ant and Jenkins. Thus Continuous Performance Testing process setup is implemented.   We are also able to run the test as and when we want by a simple click in Jenkins. While you are concentrating on other tasks, Jenkins takes care of running the test, creating the results and sending out the results for you!! It also reduces the dependency on Performance Testers. YES..!! Anyone can run the test now. You have to just the share the link for the Jenkins job you have created.

We can also make this job integrated with ‘development deployments’ jobs of Jenkins – That is…whenever a code is pushed to the given test environment,  this job gets executed automatically without any manual intervention. Any functional test and performance test can be done as early as possible to detect any issues upfront!!


Grafana Implementation for Real Time results:

Above integration, Emailing the results are nice!! But we need to wait for the test to finish to see the results. Would not it be awesome to see the results while jenkins is running the test!!??

If you have a long running test like mine and you are curious of seeing the current results while jenkins is running the test – please see one of my favourite posts on getting real time results.

Happy Testing :)


Share This:

Parameterize QTP/UFT Script to run on any test environment using Jenkins

$
0
0

Aim:

To run the QTP/UFT script on any given test environment using Jenkins.


Please read this post first to get a high level idea of basic QTP/UFT + Jenkins integration.


Creating Simple Test Script with Test Parameters:

  • Create a simple QTP/UFT test script for your application
  • Modify the QTP/UFT script to accept input parameters.
  • In my test, I am going to pass 2 parameters
    • env -> A short name of the Test Environment which QTP script has to test
    • browser -> Browser to be used by QTP/UFT script to invoke and test

ufts-01

Using Property Files:

  • Create a separate property files for each environment as shown below.
  • This property file should contain the environment specific information like URL, username and password etc

ufts-03

  • I am going to assume we have 4 environments in which we might run our test. Let them be qa1, qa2, uat and prod.

ufts-04


QTP/UFT  Test Folder Structure:

Our QTP/UFT test will contain below folders at least.

  • functions -> will contain all the vbs files
  • properties -> will contain all the properties files
  • qtpTestFolder -> this is your actual qtp test folder – the name can be anything
  • runner.vbs -> this is a vbs file which uses QTP AOM to invoke QTP

ufts-02

Reading Property Files:

These properties will be stored as Environment Values of the QTP/UFT script.  For that, We need to attach a separate vbs file which reads the property file to the QTP/UFT test.

  • Lets create a ‘TestInitialize.vbs‘ to read the property file and convert them as Environment Variables.


Public gBasePath           ' Stores the value of the current QTP test base folder.
gBasePath = CreateObject("Scripting.FileSystemObject").GetParentFolderName(Environment.Value("TestDir"))


'Load the properties as Environment Variables of QTP/UFT
LoadProperties(gBasePath & "\properties\" & env & ".properties")

'Below functions find all the properties files and create Environment variables
Sub LoadProperties(ByVal FilePath)

	Set ADODB = CreateObject("ADODB.Stream")
	On Error Resume Next
	
	ADODB.CharSet = "utf-8"
	ADODB.Open
	ADODB.LoadFromFile(FilePath)		
	
	arrData = Split(ADODB.ReadText(), vbNewLine)
	For iLoop = 0 To UBound(arrData) Step 1
		txt = arrData(iLoop)
		'Condition to read the property is 
		'It should not start with #
		'Min length should be 2
		'Position of = should not be 1
		If Left(txt, 1) <> "#" AND Len(txt) > 2 AND Instr(1, txt, "=") > 1 Then	
			intPos = Instr(1, txt, "=")
			strProp = Left(txt, intPos - 1)
			If Len(txt) > intPos Then
				strValue = Mid(txt, intPos + 1, Len(txt))
			Else
				strValue = ""
			End If
			Environment.Value(Trim(strProp)) = Trim(strValue)
		End If
	Next
	ADODB.Close
	
	On Error GoTo 0
	Set ADODB = Nothing

End Sub


  • Attach this vbs file to the test.

ufts-05

  • Now in your test you should be able to use all those variables present in the Property Files.
    • Environment.Value(“APPLICATION_URL”) will return https://qa1.testsite.com
  • Ensure that your test works fine by reading the property files.

Updating runner.vbs to accept arguments from command line:

We need a separate vbs file which uses QTP/UFT Automation Object Model to invoke QTP, open the test and run.   I name the file as runner.vbs – it will be created as shown below to accept arguments from the command line.


'Create QTP object
Set QTP = CreateObject("QuickTest.Application")
QTP.Launch
QTP.Visible = TRUE
 
'Open QTP Test
QTP.Open "qtpTestFolder", TRUE 'Set the QTP test path
 
'Set Result location
Set qtpResultsOpt = CreateObject("QuickTest.RunResultsOptions")
qtpResultsOpt.ResultsLocation = "Result path" 'Set the results location

'Set the Test Parameters
Set pDefColl = QTP.Test.ParameterDefinitions
Set qtpParams = pDefColl.GetParameters()

'Set the value for test environment through command line
On Error Resume Next
qtpParams.Item("env").Value = LCase(WScript.Arguments.Item(0))
qtpParams.Item("browser").Value = LCase(WScript.Arguments.Item(1))
On Error GoTo 0

'Attach the vbs files to the test
QTP.Test.Settings.Resources.Libraries.RemoveAll   'Remove everything
QTP.Test.Settings.Resources.Libraries.Add("..\functions\TestInitialize.vbs")
 
'Run QTP test
QTP.Test.Run qtpResultsOpt
 
'Close QTP
QTP.Test.Close
QTP.Quit


At this point, you should be able to run your test through command line on any test environment as shown here.
ufts-06


QTP/UFT should invoke successfully and run the test on the given environment. Ensure that it works before integrating with Jenkins. [If it fails, executing through jenkins is not possible]

Jenkins – Creating a Job with Parameters:

  • Create a simple freestyle job in jenkins
  • Let the job accept parameters from the users.
  • I need 2 parameters for my test. Environment and Browser

ufts-07

  • Build step should be ‘Execute Windows Batch Command’
  • Enter the command: CScript <path to the runner> %ENVIRONMENT% %BROWSER%

ufts-08

  • Select any test environment and browser from the drop down and click on Build.

ufts-09


  • We can see these values are being passed to the runner in the console and QTP/UFT executes the test in the corresponding environment and the browser.

ufts-10


Happy Testing :)


Share This:

JMeter – Save results to a database

$
0
0

In this post, Lets see how we can use Beanshell Listener / JSR223 Listener in JMeter to send the result, the way we want, to a database.  The below approach will work like Backend Listener of JMeter to post the sampler results into InfluxDB

Sample Result API:

To write the results the way we want, We will be using the SampleResult API in the listener.

Lets assume we are interested in the sample label, no of samples executed, response time, status and time-stamp the sample occurred.

  • sampleResult.getSampleLabel() – gives the sample name which just occurred.
  • sampleResult.getSampleCount() – no of samples
  • sampleResult.getTime() – duration of the sample
  • sampleResult.getResponseCode() – response code
  • sampleResult.getTimeStamp() – timestamp
  • sampleResult.isSuccessful() – true if it is success; false otherwise.

InfluxDB:

I would be using InfluxDB  as backend to store the data using its HTTP API.

Check here for more information.

At this time of this post, v0.12 is latest. Please check InfluxDB site for the latest versions installation steps as the above URLs might not work later.

Ensure that your InfluxDB is up and running. You should be able to access the admin interface on the port 8083. http://[ipaddress]:8083

Create a database ‘demo’ with this query: CREATE DATABASE “demo”.


db-tp03

JMeter Test Plan:

We would be creating a very simple test plan as shown below. I am just using a ‘Dummy Sampler’ – changed the label names.

db-tp01

JSR223 Listener:

I use JSR223 Listener with Groovy. If you do not have groovy jar, download it from here and place it in  %JMETER_HOME%/lib folder. You can also use Beanshell listener for this purpose. JMeter comes with all the required dependencies for beanshell.

In this listener we would be accessing sampleResult API directly to get the sample metrics which just occurred.

InfluxDB HTTP API interface would expect the data in the below format. So build the result string accordingly.

samples,label=lbl,status=status  count=count,duration=duration,responsecode=rc  timestamp

Add below code in the JSR223 Listener.


result = new StringBuilder();

status = "Failure";
if(sampleResult.isSuccessful())
status = "Success";

//Expected format to post the result
//samples,label=lbl,status=status count=count,duration=duration,responsecode=rc timestamp

result.append("samples,")   //samples is the measurement name which we will create at run time.
.append("label=")
.append(escapeValue(sampleResult.getSampleLabel()))
.append(",status=")
.append(status)
.append(" ")
.append("count=")
.append(sampleResult.getSampleCount())
.append(",duration=")
.append(sampleResult.getTime())
.append(",responsecode=")
.append(sampleResult.getResponseCode())
.append( " ")
.append(sampleResult.getTimeStamp())
.append("000000");

The above code will build the string to post the data. However we need to escape “,”, ” “, “=” in the string as these have some meaning in InfluxDB query.


/*

Escape the string values before posting the data

*/

String escapeValue(String val){

val = val.replaceAll(",", "\\\\,")
.replaceAll(" ", "\\\\ ")
.replaceAll("=", "\\\\=")
.trim();

return val;

}

Lets add the function which will post the data to influxDB.


/*

Post the result to influxDB

*/

import org.apache.http.HttpResponse;
import org.apache.http.client.methods.HttpPost;
import org.apache.http.entity.StringEntity;
import org.apache.http.impl.client.DefaultHttpClient;
import org.apache.http.params.BasicHttpParams;
import org.apache.http.util.EntityUtils;

void PostMeasurement(String metric){

def httpclient = new DefaultHttpClient(new BasicHttpParams());
def httpPost = new HttpPost();

//URL format : http://[ipaddress]:[port]/write?db=[database]

httpPost.setURI(new URI("http://[ipaddress]:8086/write?db=demo"));
log.info("Result : " + metric);
httpPost.setEntity(new StringEntity(metric));
HttpResponse response = httpclient.execute(httpPost);
EntityUtils.consumeQuietly(response.getEntity());

}

Thats it. Now add this line to call the function which posts the data.


PostMeasurement(result.toString());


Run the test for couple of times. Now query the InfluxDB using its Admin interface. “select * from samples” on the demo Database will show the results as shown below.

db-tp02


If you are still facing issues in sending the data to InfluxDB - Check this post to troubleshoot.

Summary:

Without using any plugins/backend listener/extending jmeter functionilities using its interface, We saw how to write the results in DB. This approach might be slow if you do not have any timers in the test plan. You can modify the approach slightly to post the data asynchronously. We can also modify the listener to post the data once in certain interval (say 30 seconds) instead of posting for every sample which will help with performance.


Happy testing 🙂


Share This:

JMeter & InfluxDB Integration – How to troubleshoot

$
0
0

This post is to troubleshoot the issues you are facing with InfluxDB while writing data using the methods mentioned in the below posts,

Please make sure all the below steps working fine in the order.

  • InfluxDB should be up and running fine w/o any exception (in the console output).
    • If this step itself fails, Please raise your question in StackOverFlow
  • You should be able to access the admin interface of InfluxDB with this URL – http://[ipaddress]:8083
    • Try to access this in the machine where JMeter is going to run.
    • If this step fails,  see if the port has been used already. or change that in InfluxDB config file.
    [admin]
      enabled = true
      bind-address = ":8083"
      https-enabled = false
      https-certificate = "/etc/ssl/influxdb.pem"
    • If you are not sure where to find the config file for InfluxDB, running the command ‘influxd config‘ which will show the default config values. Copy them and create a new .conf config file yourself.
    • If you are using new conf file, restart InfluxDB with this command – influxd -config /etc/influxdb/influxdb.conf
  • Ensure that you have the Database created in InfluxDB. If not, Run the the query ‘CREATE DATABASE “demo”‘ in the Admin Interface
  • System time of InfluxDB server should be in sync with the System time of JMeter. (at least should be ahead of Jmeter machine time. Not behind)
    This is very important as InfluxDB is a time-series DB. By default, it will show only the records where timestamp of the records < system timestamp.
  • Install ‘PostMan‘ in your chrome (Please do these steps from the machine where JMeter is going to run)
    • Add POSTMAN
    • Update the URL as shown here – http://[ipaddress]:8086/write?db=[database]
      Ex: http://10.11.12.13:8086/write?db=demo Note the port – it should be 8086 for writing the data. 8083 is for admin interface.
    • db-tp04
    • Lets try to send this record through postman testautomationguru,key=test count=1,duration=1
      • testautomationguru – is the name of table/measurement which will be created at run time by InfluxDB if it is not present already.
      • key – it is a tag for faster query
      • count and duration – some fields with values
    • HTTP Method should be POST
    • Place the data under Body –> Raw section
    • Click on ‘Send’
    • You should be able to see the testautomationguru measurement & querying the measurement should show the series.

db-tp05

db-tp06

  • Now run JMeter in non – gui mode. You should be seeing the measurements and data for the given DB.
  • If it still does not work, Please check the JMeter.log and InfluxDB console for any Errors.
    • For ex: My JMeter.log shows this info. Copy the text and try to place it in postman and try to post as you did above. There is a chance that some characters not escaped properly. yuo will know that in the HTTP response of the PostMan or share the log details with me.

db-tp07

Share This:


JMeter – Post Processors / Script Language – Comparison

$
0
0

When we do an intensive load testing with JMeter / Response data processing, we might be very careful with the type of post processor / scripting language we choose.
In this post I would like to show how these post processor / script language affects the overall performance of the test.

We would be comparing below post processors & script languages.

  • BeanShell PostProcessor
  • BSF PostProcessor – Beanshell
  • BSF PostProcessor – Javascript
  • BSF PostProcessor – Groovy
  • JSR223 PostProcessor – Beanshell
  • JSR223 PostProcessor – Javascript
  • JSR223 PostProcessor – Groovy


Test Plan:

As we have done in this post, We would be using a simple test plan without any external dependencies / timers etc as shown below to analyze the performance of these post processors accurately.

I used the JMeter 3.0 for this test.

All the Latency and ResponseTime simulation have been set 0.

test-plan

We use a Dummy Sampler to simulate hard coded response.[For response data, I took the document innertext of this page. It has more than 56000 words in it]. We would do a post processor and in the post processor, we would be splitting huge response data string into an array using this delimiter ” “. We will iterate all the elements in the array and call the toUpperCase() method. [I know it sounds stupid. Aim here is to do some very time consuming operation].

Thread Group loop count is set to 1000. We will be repeating this process 1000 times and measure the time it takes.

Beanshell PostProcessor:

I added a Beanshell post processor to the test as shown below. I ran the test. The test took exactly 50 seconds to complete.

beanshell

BSF PostProcessor – Language: Beanshell

I removed the Beanshell post processor and added BSF Post processor and chose the language as Beanshell.  I ran the test. The test took exactly 54 seconds to complete.

bsf-beanshell

BSF PostProcessor – Language: Javascript

With Javascript, The test took around 46 seconds to complete.

bsf-js


BSF PostProcessor – Language: Groovy

With Groovy, The test took around 24 seconds to complete.

bsf-groovy

JSR223 PostProcessor

I did the same test with JSR223 PostProcessor for different languages like Beanshell, Javascript and Groovy.

jsr223-groovy


Conclusion:

After repeating the same test couple of times, I get the results as shown here.

results

From the above results, Groovy seems to be performing much better compared to Beanshell and Javascript. I always used Beanshell for the pre/post processing before. I modified my tests to use Groovy engine after this.  If your test plan consumes more time in pre/post processing activity, the performance result you get is not reliable. If we had used this approach to test an application performance, with different processors/script languages, we would have got completely different performance metrics for the application.  For better performance of the JMeter test/more accurate performance metrics, It is recommended to use Groovy.


Happy Testing 🙂


Share This:

JMeter Distributed Load Testing using Docker

$
0
0

A single JMeter instance might not be able to generate enough load to stress test your application. As this site shows, one JMeter instance will be able to control many other remote JMeter instances and generate larger load on your application. JMeter uses Java RMI [Remote Method Invocation] to interact with objects in a distributed network.

JMeter master and slave communicate as shown in the below picture.

jm-master-slave-2

We need to open 2 ports for each Slave/Server.

Server_port=1099
server.rmi.localport=50000

Open a port in client machine for slaves to sends the results to master.

client.rmi.localport=60000

By running multiple instances of JMeter as server in multiple machines we can generate as much load as we need.

JMeter-Docker-Basic - New Page

Docker:

What is the use of docker here?

Docker is a bit like a virtual machine. But unlike a virtual machine, rather than creating a whole virtual operating system, Docker allows applications to use the same Linux kernel as the system that they’re running on and only requires applications be shipped with things not already running on the host computer. This gives a significant performance boost and reduces the size of the application – source: opensource.com

Docker is a manager of Infrastructure. It will be able to package a software and all its dependencies to run as a container. You can deploy the software, packaged as a docker image, in any machine where docker is installed. It, kind of, separates the software from the hardware – so the developer can rest assured that the application will run on any machine regardless of any customized settings that machine might have that could differ from the machine used for writing and testing the code.

Docker’s role in JMeter Distributed Testing:

If we look at the above setup – to do distributed load testing – we need 1 master & we need N number of slaves to generate huge load. Each and every JMeter slave machine needs to have specific version of Java and JMeter installed. Specific ports should be opened and JMeter server should be running, ready and waiting for the master to send the instruction.

Setting up few machines manually might look easy. What if we have to do this for 50, 100, 1000 machines? Also imagine what will happen if we need to upgrade JMeter versions in all the machines in future!! That is where docker comes into picture.

We basically setup the whole infrastructure for JMeter distributed testing in a file called Dockerfile. Check these dockerfiles and read the comments to understand what each step does.

Dockerfile for JMeter Server / Slave:

Dockerfile for JMeter Client / Master:


As you see in the above Dockerfile, if we need to change the Java / JMeter version / port, I just need to update the dockerfile and Docker will take care of the rest.

I have pushed these dockerfiles into docker hub under vinsdocker account. So anyone will be able to pull those files and set up the JMeter distributed testing infrastructure.

  • Ensure that docker is installed in your machine. Once it is installed, the rest is easy. You just need to follow the steps here.
  • Run below commands one by one.
sudo docker run -dit --name slave01 vinsdocker/jmserver /bin/bash
sudo docker run -dit --name slave02 vinsdocker/jmserver /bin/bash
sudo docker run -dit --name slave03 vinsdocker/jmserver /bin/bash

Docker will automatically pull the docker image I have uploaded and create 3 containers for JMeter server. If you need more containers, keep executing above command just by changing the container name.

  • Run the below command to create a container for JMeter master.
sudo docker run -dit --name master vinsdocker/jmmaster /bin/bash
  • Run below command to see all the running containers and ports opened etc.
sudo docker ps -a

docker-jm-server-containers

  • Run the below command to get the list of ip addresses for these containers.
sudo docker inspect --format '{{ .Name }} => {{ .NetworkSettings.IPAddress }}' $(sudo docker ps -a -q)

containers-ip

  • I create a very simple JMeter test plan to test the setup with 5 threads – scheduled to run for 120 seconds.

jm-test-plan


  • By issuing below command, I copy the test into my JMeter master container. This command will copy my local jmeter test (docker-test.jmx) into the master container in this path: /jmeter/apache-jmeter-2.13/bin/docker-test.jmx
sudo docker exec -i master sh -c 'cat > /jmeter/apache-jmeter-2.13/bin/docker-test.jmx' < docker-test.jmx
  • Go inside the container with the below command and we can see if the file has been copied successfully.
 sudo docker exec -it master /bin/bash

docker-master

  • Lets run the test in master to see if it works fine [not in distributed mode]. Docker container will be able to run the JMeter test as it has all the softwares & dependencies to run the JMeter test.

docker-master-run

  • That’s it. We are now ready for running our test in distributed using docker containers. We just need to append -R[slave01,slave02,slave03]

docker-slaves-run


If you had noticed, we create all the containers in the same host. Ie, the JMeter and JMeter slaves are all running in the same machine. So the all the system resources would be shared by these containers.

jm-master-slave-host-docker

Summary:

In this post, our aim was to use Docker to create the JMeter distributed testing infrastructure. If you had followed the above steps, you would have understood that creating the test infrastructure using docker is very easy and fast. We write the whole infrastructure in a file which can be version controlled. Then we create an instance (container) from the file. Docker ensures that the container has all the softwares and dependencies etc.

You might ask if it is ok to run multiple jmeter server instances in one machine to generate more load! No, It is not OK. It will not help at all. In fact, One instance of JMeter will be able to generate more load than running multiple instances of JMeter in the same host.

So why did we use docker and do all these?

As I said above,  our aim here is to understand how docker works in JMeter testing. We can understand the real use of docker when we use AWS/digitalocean, cloud computing service providers, where you can create any number of VMs on demand. We will see that in the next post!


Happy Testing 🙂


Note: If you have any questions related to docker install, I request you to raise that in StackOverFlow.


Share This:

JMeter Distributed Load Testing using Docker in AWS

$
0
0

In the Previous post, We had learnt how to use docker in creating multiple containers running jmeter-server for distributed load testing. But we had created all the containers in the same host. Even if we can not use the single-host containers for performance testing with huge load, before pushing your performance test script related changes to AWS/any other cloud service providers, that setup will be useful to test your scripts in local.

In this post, we will see how to use docker in AWS for JMeter distributed load testing.

Creating AWS Instances:

  • I created 3 t2-micro instances in AWS.
    • Image Id: ami-d732f0b7
  • Added a security group as shows here.

aws-fw-01

  • Installed latest version of docker. Check here for installation steps.

Creating docker-containers:

As our AWS instances are up and running, Lets create a docker container on each host by issuing below commands.

  • JMeter-Master: On one of the instances, we will run below command.
    • sudo docker run -dit --name master vinsdocker/jmmaster /bin/bash
  • JMeter-Server/Slave: On remaining instances, we will run below command to create jmeter-server container.
    • sudo docker run -dit vinsdocker/jmserver /bin/bash

Now we have docker containers for jmeter-master and jmeter-server are up and running fine with all the dependencies. If we try to find the IP address of these containers, they all might look same – [172.17.0.1] for all the containers. So, our jmeter test will NOT work in this set up as master can not identify the slaves in the network.  If you remember, we ran all our docker-containers on same host. The containers on the same host will be able to talk among themselves with container’s specific IP address as docker-engine creates a default network for these containers on the same host.

jm-master-slave-host-docker

But in this AWS, the set up is almost as shown below. The master-container inside the host can NOT talk to the slave-containers on the other hosts – because containers on each host will be in their own separate network. So they can not communicate.aws-docker-container-01

The communication among the docker-containers on different hosts will be routed via their hosts. So, it can be easily fixed by using  port mapping & using host IP instead of containers.

First lets run below command to stop and delete all the containers.

sudo docker stop $(sudo docker ps -a -q)
sudo docker rm $(sudo docker ps -a -q)

Port MappingWhile creating a container, we will be mapping the exposed ports of containers to a host port. So, by talking to host on the mapped port, you will be talking to the actual container.

java.rmi.server.hostname Property: As the containers have their own ip addresses, we need to make Jmeter to communicate via host ip by updating java.rmi.server.hostname. For more info on java rmi properties, check here.

Dockerfile for JMeter Client / Master:

It does not require any change.

Dockerfile for JMeter Server / Slave:

It needs to be modified slightly as shown here.  I have added -Djava.rmi.server.hostname=$LOCALIP while starting jmeter-server.sh. LOCALIP will be a variable and the value will be passed at run time while creating the container.


Lets create jmeter-server containers on each host [except master] using below command. [Note: I have used different docker image – vinsdocker/jmawsserver]

sudo docker run -dit -e LOCALIP='52.10.0.2' -p 1099:1099 -p 50000:50000 vinsdocker/jmawsserver /bin/bash
sudo docker run -dit -e LOCALIP='52.10.0.3' -p 1099:1099 -p 50000:50000 vinsdocker/jmawsserver /bin/bash
sudo docker run -dit -e LOCALIP='52.10.0.4' -p 1099:1099 -p 50000:50000 vinsdocker/jmawsserver /bin/bash
  • LOCALIP should be the public IP address of the host.
  • -p 1099:1099 – is used to map the 1099 port of the container with the host port 1099
  • -p 50000:50000 – is used to map the 1099 port of the container with the host port 50000

Run the below command on master host to create a jmeter master container.

sudo docker run -dit --name master -p 60000:60000 vinsdocker/jmmaster /bin/bash
  • Container port 60000 is mapped to the host port 60000.

After creating all the containers, the setup is almost as shown below.


We can run the test now in the master container by issuing below command.

./jmeter -n -t docker-test.jmx -Djava.rmi.server.hostname=52.10.0.1 -Dclient.rmi.localport=60000 -R52.10.0.2,52.10.0.3
  • -Djava.rmi.server.hostname=52.10.0.1 -> exposes the jmeter-master IP to the slave containers
  • -Dclient.rmi.localport=60000 -> listening port of host
  • -R52.10.0.2,52.10.0.3 -> Slaves host IP address


Summary:

By using docker, we do not need to worry if we have same version of jmeter and java are installed on each host. docker take cares of all these.  Using docker-containers on a single host was very simple and straight forward. But when you use it in AWS, in order to make the containers talk among themselves, we need to use java.rmi.server.hostname property and port mapping. Once we do these, then everything works as expected.

Instead of using LOCALIP variable while creating a docker jmeter-server container, we can also use below techniques to communicate with slaves.

  • ssh [port fowarding technique] .
  • docker-multihost-network/docker swarm

We will see how to use above techniques in the next post.


Happy Testing 🙂


Share This:

QTP/UFT – Jenkins – GitHub / SVN Integration

$
0
0

I get many comments from the readers to include a post on Jenkins-QTP-Source control integration & issues they are facing while trying to implement Jenkins-QTP console output which this post talks about. In this post, I would like to show how we can configure Jenkins to fetch the automated test scripts from the source control system like SVN/Github & showing the test case details in the Jenkins console. You can use any Source Control System like perforce. The idea is same. Ensure that you have Jenkins plugin is installed.

Sample QTP/UFT Script:

I am going to create a very simple QTP test script as shown below which launches a website in IE and check if an object is present or not. [I have uploaded the script in GitHub. You can download the script and play with it]

vsvn00

GitHub:

  • The above sample test scripts have been uploaded here.
  • I assume You already have Jenkins installed and a slave is configured.
  • Ensure that the Slave is configured with git. Download and install.
  • Lets create a simple and freestyle job in Jenkins.

vsvn04

  • Lets assume this job accepts some parameter from the user. Example: The environment of the application under test.  [Actually the sample script does not do anything with this parameter. I just wanted to show it is possible to pass a parameter].

vsvn05b

  • Select GitHub in the Source Code Management and update the URL as https://github.com/vinsguru/tag-qtp-jenkins-demo.git

vsvn10

  • Build section should have ‘Execute Windows batch command’ and the command should be ‘CScript runner.vbs %ENVIRONMENT%

vsvn06

  • Jenkins Job is ready to fetch the script from GitHub now. Click on Build to execute the scripts from Jenkins in the Slave machine.

vsvn08

  • Jenkins automatically downloads the script from github to the slave machine and executes it on the slave machine. [I assumed Slave has QTP installed].
  • It executes the script and shows the test case details being executed in the Jenkins console output and the status.

vsvn11

SVN:

You can also use Visual SVN Server which is FREE if you do not want to share your script in GitHub. 

  • Download and install from here.
  • Once installed, Create a Repository with default branches.

vsvn01

  • Create users and provide appropriate access. [For Jenkins, I create a separate user with readonly access]
  • Right click on the folder and copy the URL which you can access from any machine.

vsvn01b

vsvn02

  • VisualSVN Server is ready now which is up and running. We need a SVN client to push the script to the SVN server. We can use TortoiseSVN for this purpose.
  • Download and install TortoiseSVN from here.
  • Once installed, Create a folder – Right click – Do a SVN Checkout of the URL you have copied.
  • Copy all your test scripts under the folder – right click – Do SVN Commit.
  • This will push all your test scripts to the Visual SVN Server.

vsvn03

Jenkins-SVN Integration:

  • Select Subversion in the Source Code Management. Update the Repository URL to be checked out by Jenkins to run the script.
  • If it requires a credential, Add the Credentials. [If you do not see this, there is a Jenkins plugin. Install it in Jenkins]
  • Update the Check-out strategy as shown here.


vsvn04b

  • Credentials Plugin for Jenkins

vsvn05

  • Everything else will remain same. Click on Build to run the QTP script.

vsvn09


Happy Testing 🙂


Share This:

Selenium WebDriver automation using Arquillian Framework

$
0
0

I have been using Arquillian Graphene framework for more than a year for automated functional testing using Selenium WebDriver. I absolutely LOVE this framework. It is so easy to use and really helpful to keep your tests neat and clean by maintaining the test config in a separate file, by injecting the resources at run time when it is required etc.

Initially it was a bit hard for me to understand how it works as it was very confusing and I failed few times in finding all the maven dependencies to make it work. I am going to make it easy for you by showing you a very simple ‘Google Search’ project using Arquillian [the client mode].

What is Arquillian?

Arquillian is an integration/functional testing framework for testing JVM based application. It nicely integrates with other testing frameworks like JUnit/TestNG and helps to manage life cycle of the test and provides many other useful extensions. For functional browser automation, Arquillian provides Drone and Graphene extensions – both are built on top of Selenium WebDriver.

Test run Modes:

Arquillian can run the tests in below modes.

  • Container
    • runs tests with container, manages life cycle of container including deployment.
    • Useful for developer’s integration tetsing
  • Stand-alone / Client
    • runs tests without container integration, only lifecycle of extensions is managed
    • allows to write tests independently of Arquillian containers and deployment management
    • For automated blackbox functional testing. [This is the mode we would be using for our tests]

Drone:

Drone is an Arquillian extension to manage the life cycle of the browser in the Arquillian tests. It helps to keep all the browser related test configuration in a separate file called ‘arquillian.xml’ outside of the java code. Drone simply takes care of WebDriver instance creation and configuration and then it delegates this session to Graphene.  Check here for more info.

Graphene:

Graphene is designed as set of extensions for Selenium WebDriver that focuses on rapid development and usability in Java environment. It has below nice features.

  • Page Objects and Page Fragments – Grahpene lets you write tests in a consistent level of abstraction using Page Objects and Page Fragments.
    • Better, robust and readable tests.
  • Guards the requests to the server which was raised by the interaction of the user with the browser.
  • Improved waiting API.
  • JQuery selectors as a location strategy.
  • AngularJS support
  • Browser/Driver injection to the test on the fly.
  • Can take screenshots while testing (see screenshooter extension), and together with other useful info generate neat reports (see Arquillian Recorder extension).

Lets create a simple project for WebDriver automation using Arquillian Grpahene.

Maven Dependency:

Include below mvn dependencies to bring the power of Aruqillian graphene into your existing Java-Webdriver automation framework. [I used TestNG extension for Arquillian framework. You can also use the JUnit extension]

Arquillian Project: 

  • Create a maven project in your favorite editor.
  • Include above maven dependencies in the pom file.
  • Add ‘arquillian.xml’ file to keep all your test configuration as shown here.

arq-01

  • We will use Firefox browser in our webdriver tests.
  • Creating a simple Google page object as shown here.

@Location("https://www.google.com")
public class Google {

    @Drone
    private WebDriver driver;

    @FindBy(name = "q")
    private WebElement searchBox;

    @FindBy(name = "btnG")
    private WebElement searchbutton;

    @FindByJQuery(".rc")
    private List <WebElement> results;

    public void searchFor(String searchQuery) {

        //Search
        searchBox.sendKeys(searchQuery);

        //Graphene gurads the request and waits for the response
        Graphene.guardAjax(this.searchbutton).click();

        //Print the result count
        System.out.println("Result count:" + results.size());

    }
}

  • Create a simple TestNG test to test Google search functionality.

@RunAsClient
public class Test1 extends Arquillian{

	  @Test(dataProvider = Arquillian.ARQUILLIAN_DATA_PROVIDER)
	  public void googleSearchTest(@InitialPage Google GooglePage) {
		 GooglePage.searchFor("Arquillian Graphene"); 
  }
}


  • If we run this test now, We can see TestNG doing the following.
    • automatically launches the firefox browser
    • access the Google site
    • searches for ‘Arquillian Graphene’
    • prints the search result count

Arquillian Graphene Features:

    • Driver Injection: If you notice the above Google page object / TestNG test class, We have not created any instance of the WebDriver.
      • This is because, Arquillian maintains all the test configuration in a simple file called ‘arquillian.xml’ where we mention we will invoke Firefox browser.
      • Now simply change the browser property to phantomjs to run this test on PhantomJS without touching Java code.
      • Check here for more information.
    • Request Guards:
      • Graphene provides a nice set of APIs to handle the HTTP/AJAX requests browser makes to the server.
      • We do not need to use any implicit/explicit WebDriver wait statements. Graphene takes care of those things for us.
      • Check here for more information.
    • JQuery Selectors:
      • Graphene also provides a JQuery location strategy to find the elements on browser.
      • My example above was very simple. To understand this better, include below code in the google page object.
      • Without JQuery selectors, If we need only the visible links, then we need to get all links and iterate all links objects and find only visible links.
      • With JQuery selectors, Grphene makes it very easy for us to find only visible elements. It improves the overall performance of your tests drastically.
 
   @FindByJQuery("a") 
   private List<WebElement> allLinks; 
   
   @FindByJQuery("a:visible")
    private List<WebElement> allVisibleLinks; 
  • Page Injection:
    • Like WebDriver/Browser injection, Graphene also injects the page objects on the fly.
    • You do not need to create an instance of the Page classes yourself in the code. Graphene takes care of those things for us.
    • Consider below example to see how Graphene makes the test readable and elegant.
    • Graphene ensures that Page objects are injected only when it is invoked in your tests. So All the elements of the page class will be available for you when you need it.
      • Grphene injects an instance of Order page into OrderPage variable only when this statement gets executed. OrderPage.enterPaymentInformation() in the below code.
      • There is no ‘new’ keyword anywhere in the script which makes the script looks neat 🙂

@RunAsClient
public class NewTest extends Arquillian {
	
	@Page
	Login LoginPage;
	
	@Page
	Search SearchPage;
	
	@Page
	Order OrderPage;
	
	@Test
	public void f() {  
		LoginPage.LoginAsValidUser();
		SearchPage.searchForProduct();
		OrderPage.enterPaymentInformation();
		OrderPage.confirmOrder();  
	}
}

  • Page Fragments:
    • Like Page Objects, Graphene lets you encapsulate certain elements & its behavior / decouple a HTML structure from the Page Object.
  • Javascript Interface:
    • Graphene lets you inject a custom Javascript code on the DOM and directly access the JavaScript object like a Java object in the code.
  • AngularJS application automation:
    • Protractor framework is not the only solution for AngularJS applications. Arquillian has a nice extension for finding angular elements.
    • Check here for more information.
  • SauceLabs / BrowserStack support:
    • Arquillian has an extension for BrowserStack. That is, the above script we have created can be simply run on any mobile device / platform / browser just by updating the arquillian.xml by including the browserstack account details.
    • I was just blown away when I was able to run all my tests w/o any issues in BrowserStack w/o touching the code.
    • Check here for more information.
  • Custom extension:
    • You can also implement your custom extension and include it in the framework.

Summary:

We saw the basic features of Arquillian Graphene framework and how it makes our test more readable with its browser and page objects injection on the fly and handling the HTTP/AJAX requests.

We will see many other Arquillian extentions in the upcoming posts.


Happy testing 🙂

Share This:

Viewing all 233 articles
Browse latest View live


Latest Images